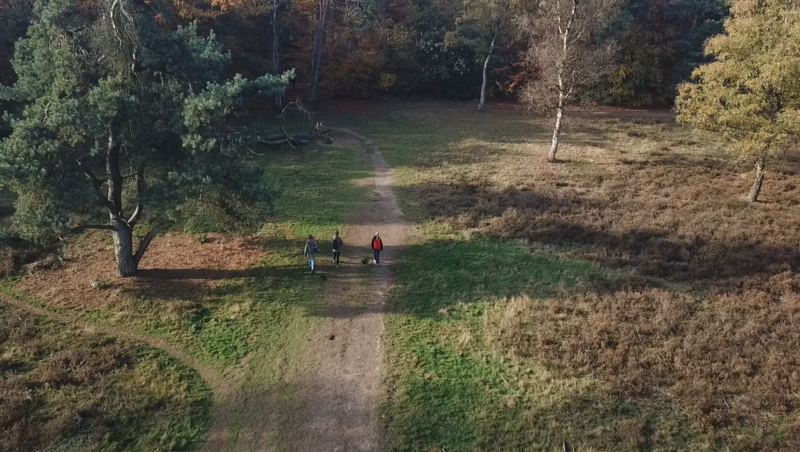




The Temperature map reveals how heat is felt, distributed, and expected to change across the Netherlands. It goes far beyond just the weather; this map includes both current and future temperature indicators, from heat stress and tropical days to the number of warm nights and frost days. Whether you’re walking through a park or a city center, this map shows how heat affects different places and people very differently.
Pourquoi choisir cette carte ?
Because understanding heat islands brings us closer to solving them ☀️🌡️
🚙 Take me on a test-drive (Clickable) ⬆️
This map helps you explore how climate and comfort interact in your surroundings. Use it to discuss urban heat islands, climate change, and social vulnerability to heat during your excursion. It’s perfect for exploring themes like climate adaptation, public health, or spatial inequality.
Inclut un menu déroulant !
The dropdown lets you switch between layers showing heat sensation over time, future projections of hot and cold days, urban heat effects, and the social vulnerability of people to heat stress.
💡 Combine it with land use or vegetation maps to understand what keeps a place cool or not.
📍 Source : https://www.klimaateffectatlas.nl/
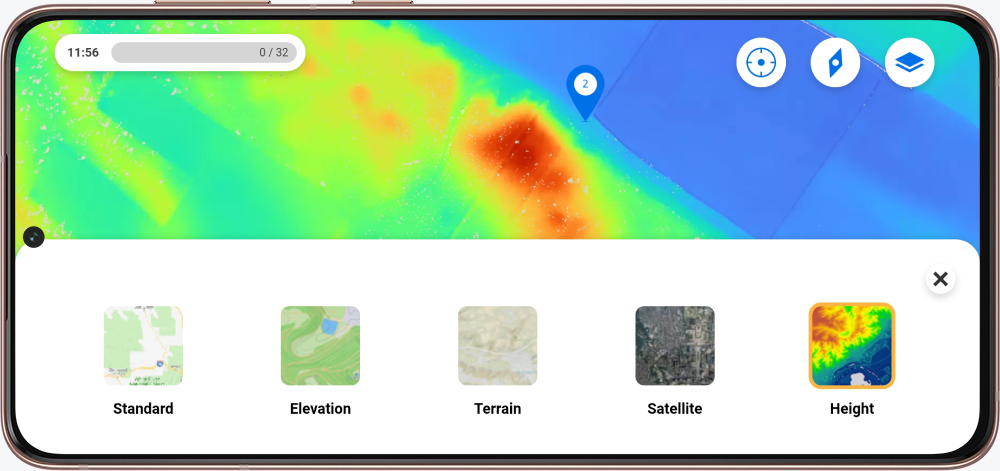
Vous avez hâte que la carte fasse partie de votre excursion ? Dans le Mon Peek environnement, vous pouvez demander une carte en remplissant les formulaires.
Vous êtes nouveau à Peek et vous êtes curieux de connaître les possibilités offertes ? Contactez nous !