



The Flood Risk map visualizes how deep water could get during different flooding scenarios across the Netherlands. From dike breaches to extreme rainfall, this map shows both the chance of flooding and the depth of water you might expect. It’s a powerful tool for understanding safety, vulnerability, and the impact of climate change, especially in a low-lying country like the Netherlands. You’ll see not only where water might come, but how high it could rise.
Pourquoi choisir cette carte ?
Because knowing where water goes is knowing where we’re safe 💧🏠
🚙 Take me on a test-drive (Clickable) ⬆️
This map helps make flood risk visible and real. Use it to discuss water safety, dike protection, future climate adaptation, or even local resilience. Whether you’re near a river, a polder, or an urban area, this map makes the invisible visible.
Inclut un menu déroulant !
The dropdown lets you explore different types of flood risk: water depth based on flood probability, current and future risk scenarios, climate policy standards, and extreme rainfall simulations.
💡 Combine it with elevation and land use maps to explore flood impact in context.
📍 Source : https://www.klimaateffectatlas.nl/
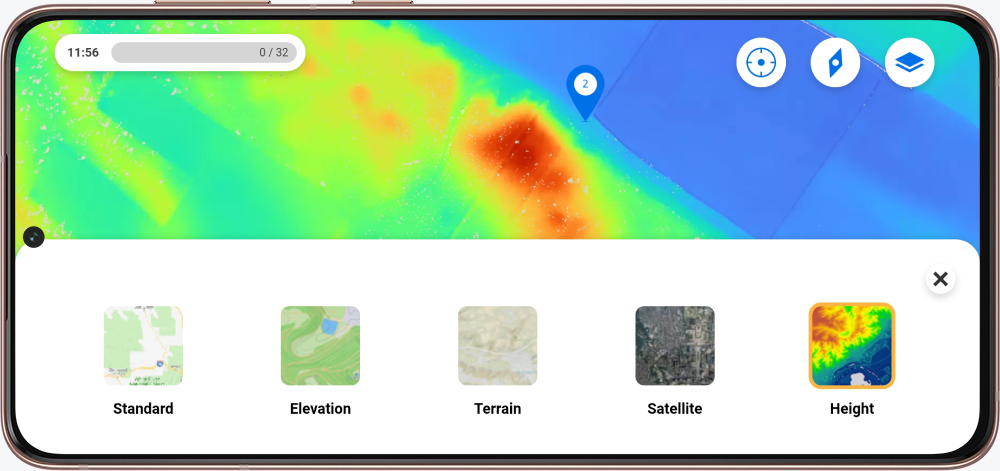
Vous avez hâte que la carte fasse partie de votre excursion ? Dans le Mon Peek environnement, vous pouvez demander une carte en remplissant les formulaires.
Vous êtes nouveau à Peek et vous êtes curieux de connaître les possibilités offertes ? Contactez nous !