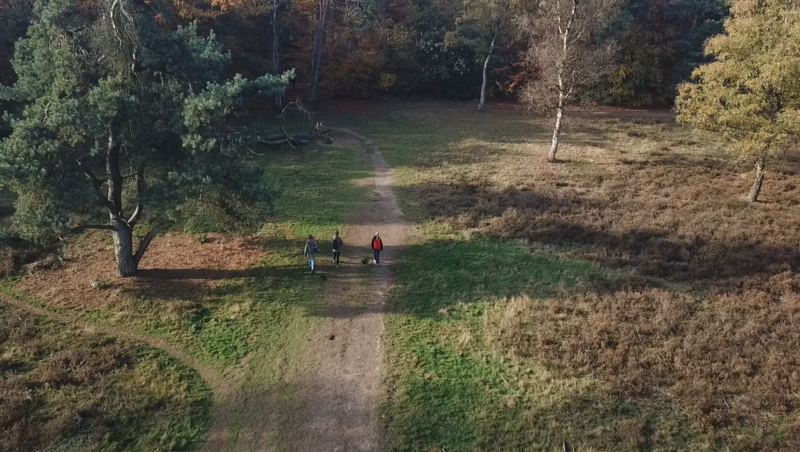




The Drought map shows how dry conditions affect the landscape, now and in the future. It visualizes groundwater levels, drought stress on nature, and changes in evaporation, giving a detailed picture of where water shortages hit the hardest. It’s an essential layer for understanding the hidden impact of droughts on agriculture, ecosystems, and water management.
Waarom kiezen voor deze kaart?
Because dryness isn’t always visible 🌿💧
Maak een proefrit met me (Klikbaar) ⬆️
This map makes the invisible stress of drought real. Use it to talk about groundwater, vulnerable natural areas, or the future of farming in the Netherlands. It’s perfect for excursions focused on sustainability, climate adaptation, or soil and water dynamics.
Inclusief een dropdown!
The dropdown includes layers showing current and future drought stress, groundwater highs and lows, changes in summer water levels, and maps highlighting vulnerable ecosystems and changes in evaporation and infiltration.
💡 Combine it with land use or vegetation maps to explore the relationship between land cover and water availability.
Bron: https://www.klimaateffectatlas.nl/
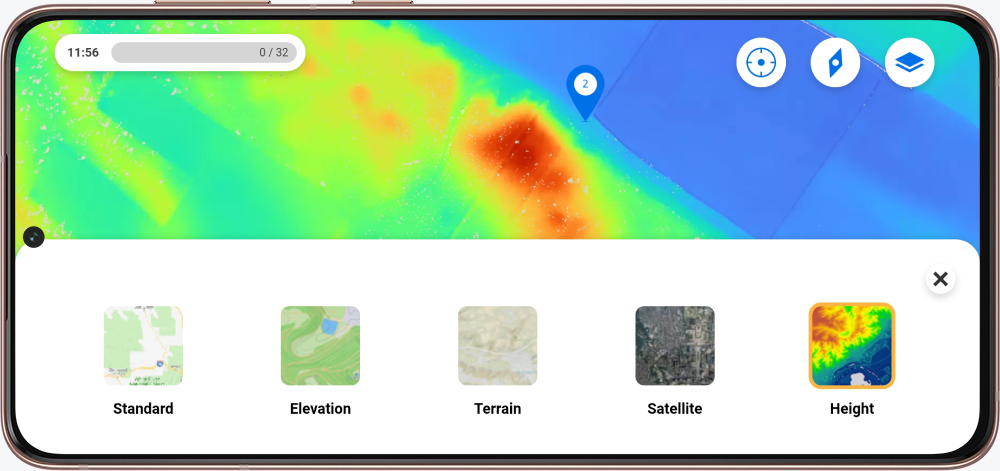
Heb je zin in de kaart voor je excursie? In de Mijn Peek omgeving kun je een kaart aanvragen door de formulieren in te vullen.
Nieuw bij Peek en nieuwsgierig naar de mogelijkheden? Neem contact met ons op!