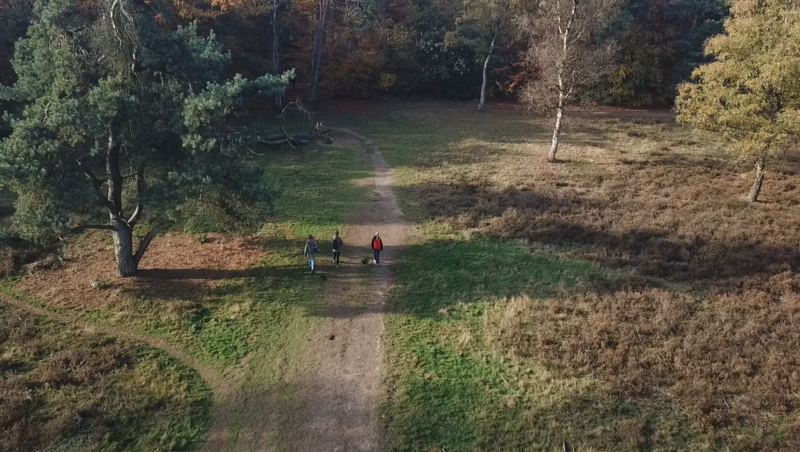




At Peek, we believe every excursion tells a different story and that every story deserves to be brought to life. That’s why we provide “The Peek Atlas”, which contains a wide range of map layers, from elevation to flood risks, from urban growth to cool spots on a hot day. All of these can be added directly to your Peek excursion, helping you tailor each walk to your lesson goals.
By combining maps with the places you visit, your excursion becomes more immersive, your questions more meaningful, and your story more grounded in the real world. With Peek, it’s easy to dive deeper, inspire curiosity, and create memorable learning experiences, one layer at a time.
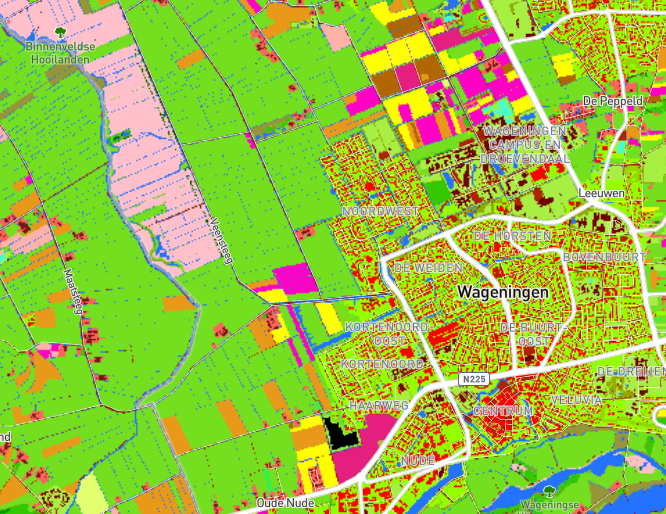
Land Use
This map shows how land is used: cities, farms, nature, and industry. It makes clear what we do with our space and how people and nature interact. Great for lessons on planning, sustainability, and society.
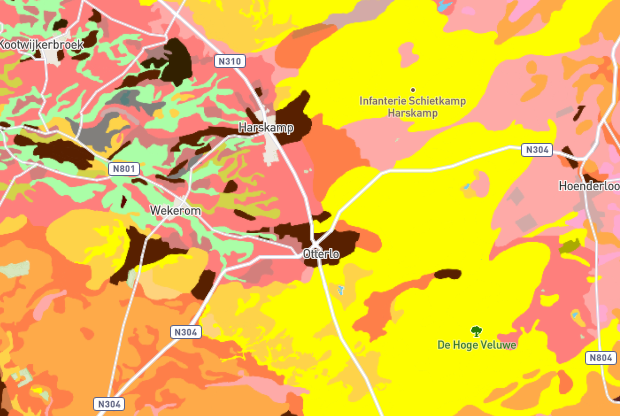
Soil Type
Discover the soils of the Netherlands: sand, clay, peat, and loam. Each soil shapes land use, water, and nature in unique ways. A great foundation for lessons on farming, ecology, and geology.
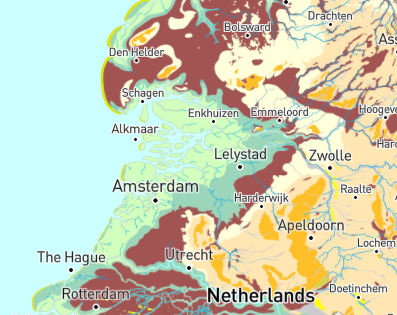
Paleogeography
Travel back in time with maps from 9000 BC to today. See how rivers, seas, and coastlines have shifted over millennia. A fascinating way to connect history, archaeology, and landscape.
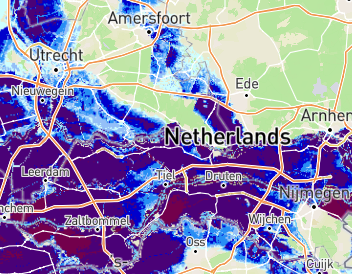
Floodings
See how deep water can get during floods and where risks are highest. This map covers both current risks and future scenarios with climate change. Ideal for excursions on water safety and resilience.
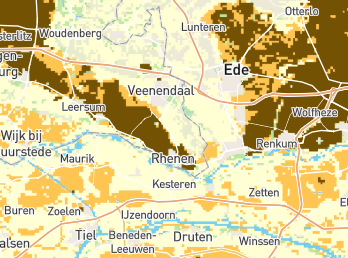
Droughts
Explore where drought stress is strongest, how groundwater levels are changing, and how nature and farming are affected. This map highlights hidden water shortages. Perfect for excursions on sustainability and climate impacts.
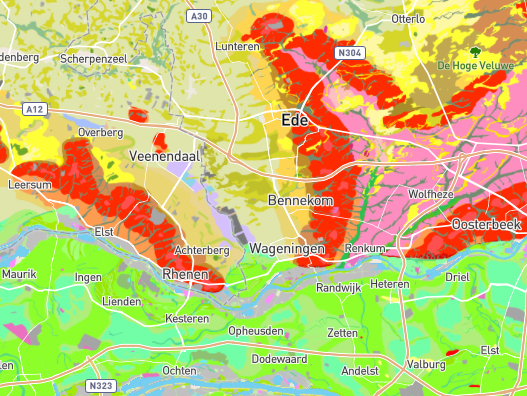
Geormorphology
See the natural shapes of the Dutch landscape: riverbanks, dunes, stream channels, and glacial formations. It’s like a fingerprint of how water, wind, and ice shaped the land. Perfect for excursions on geology or earth history.
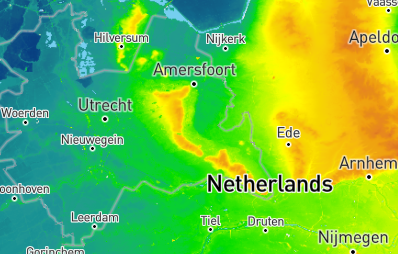
Elevation
The detailed height map of the Netherlands shows small differences in height and reveals why water flows the way it does. Essential for excursions about flooding, water management, or geography.
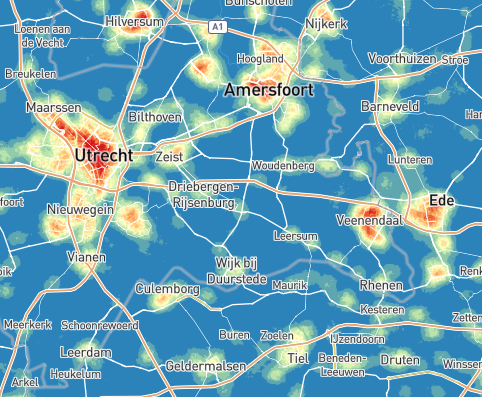
Temperature
Discover how heat is felt and distributed. From heat islands in cities to projections of hot days and warm nights, this map makes climate change visible. A powerful tool for discussing adaptation and health.
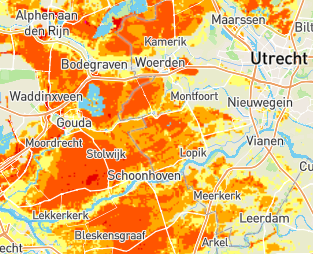
Subsidence
This map shows where the ground in the Netherlands is sinking and how fast. Causes include peat oxidation and groundwater extraction. It’s key for lessons on climate adaptation and soil management.
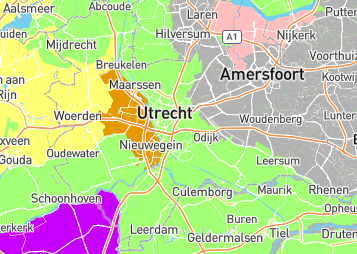
Hydrology
This map reveals how water moves through the landscape. It shows shortages, groundwater risks, erosion, and even how surface waters warm with climate change. Great for teaching about the water cycle and adaptation.
Looking for something specific? Is there a map layer you want for your excursion that is not in the list above? Please don’t hesitate to contact us, we’re happy to help you find or add the right one.
Need inspiration?
Check out the wide range of public map sources at the PDOK Viewer and the Klimaateffectatlas.