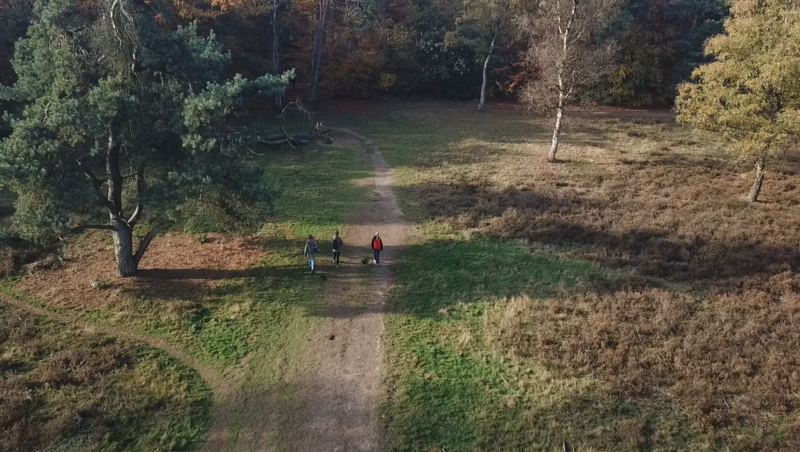




The Land Subsidence Map shows where and how fast the ground in the Netherlands is sinking. Caused by factors like peat oxidation, groundwater extraction, and soil compaction, land subsidence can damage buildings, infrastructure, and increase flood risk, especially in low-lying areas. This map makes an invisible process visible, letting you see where the land is literally dropping beneath our feet.
Perché scegliere questa mappa?
Because the ground isn’t always as stable as it seems ⬇️🏚️
🚙 Portami a fare un giro di prova (cliccabile) ⬆️
This map helps you explore a slow but serious threat. Use it to discuss climate adaptation, soil health, long-term infrastructure planning, or the hidden costs of land use. It’s perfect for sparking conversations about how we live on and with the land.
Include un menu a tendina!
The dropdown includes future projections of land subsidence under different climate scenarios (2050 & 2100), as well as signal maps showing recent short-term changes across specific periods.
💡 Combine it with elevation and flood risk layers to show the combined impact of subsidence and sea-level rise.
📍 Fonte: https://www.klimaateffectatlas.nl/
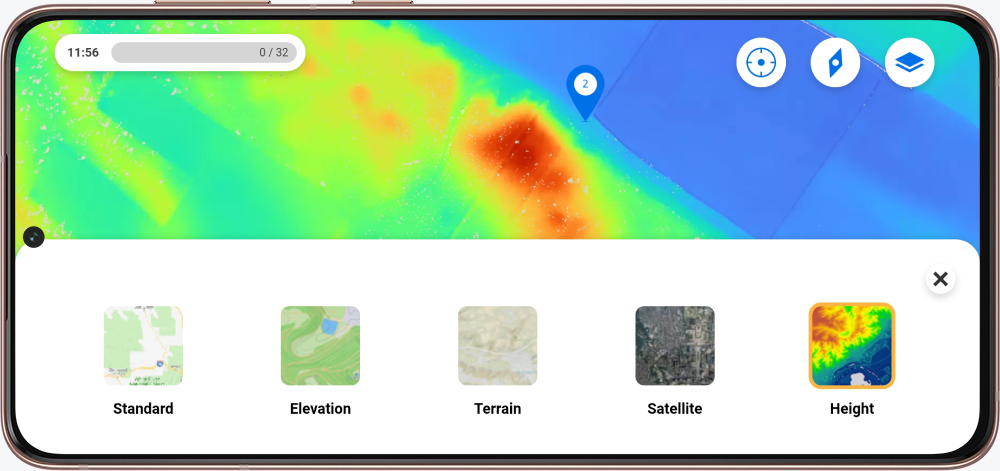
Non vedete l'ora che la mappa sia presente nella vostra escursione? Nella Il mio Peek ambiente, è possibile richiedere una mappa compilando i moduli.
Siete nuovi all'Peek e siete curiosi di conoscere le possibilità offerte? Contattateci!